ANALYSIS AND PREDICTION OF CONVECTIVE INITIATION ALONG A DRYLINE
1. INTRODUCTION
The dryline of the southern Plains is frequently the focus of severe storms during the spring and early summer. The location and timing of convective initiation are of particular interest for the prediction of deep convection and severe storms. Due to the lack of very fine-scale observation and sound theoretical understanding of the convective initiation, accurate analysis and prediction of the initiation and subsequent development of convection along the dryline are still difficult tasks. On the other hand, recent development of meso- and storm scale numerical models now provide the ability to represent the evolution of the mesoscale circulations and storm environments with acceptable accuracy. Recent field experiments such as VORTEX also provided more intensive observations. In this study we use a numerical model and various observational data to investigate the initiation of deep, moist convection along a typical dry line that occurred on May 7, 1995.
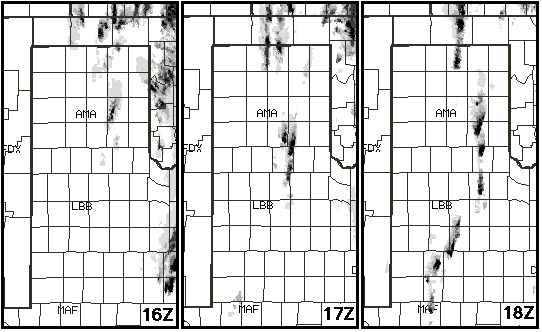
Fig.1. Observed radar reflectivity in the Texas Panhandle r area at 1600 (a), 1700 (b) and 1800 UTC (c), 7 May 1995.
At 1200 UTC, May 7, 1995, a clearly-defined dry line was observed along the New Mexico-Texas border. As it moved eastward into Texas, a band of convective clouds developed at 1600 UTC in the Texas panhandle, stretching from Northeast of Lubbock towards southwestern Kansas (Fig.1). In the next two hours 2 hours, more convective clouds developed in the western Texas area south of Lubbock. It stretched south parallel to the dry line, but lagged behind the clouds in the North by 50-100km. The convections soon are intensified and organized into a solid line, which evolved into a typical mid-latitude squall line when it moved across the western border of Oklahoma at 2000 UTC. On the synoptic scale, a deep extratropical cyclone was moving relatively slowly through the southern Rocky Mountains, with a vigorous trough at 500hPa over Arizona. At 850 hPa and below, southerly low-level flow through central Texas and Oklahoma was bring warm and moist air.
In this paper, we present an analysis on the initiation of the convection along the dryline using both observational and model simmulated data.
2. DATA, MODEL, AND ANALYSIS PROCEDURE
The data used in this study include the 60 km Rapid Update Cycle (RUC) model analyses, surface observation such as SAO's, ASOS and the Oklahoma mesonet, and additional sounding and wind profiler data collected in the VORTEX-95 field experiment. Xue et al. (1998) describe the simulations of this case using the Advanced Regional Prediction System (or ARPS, Xue et al, 1995), a three-dimensional nonhydrostatic model. The ARPS objective analysis and initialization package is used to create the model initial and lateral boundary conditions. The model is integrated in a one way nested manner to simulate the initiation and evolution of the convection and squall line, initialized at 12 UTC for both the coarse (18km) and the fine (6km) grid. Intermittent data assimilation method was used on the fine grid during the first 6 hours (Xue et al. 1998). and Wang et al. (1998) demonstrate that the major events during the 18 hours after model initiation, especially the rainfall amount and pattern, and the structure and the propagation of the squall line, are all successfully simulated. In this article, the process of initiation and early development of the deep convection during the first 6 hours after 1200 UTC, is investigated based on these simulations.
3. ANALYSIS AND SIMULATION OF CONVECTIVE INITIATION
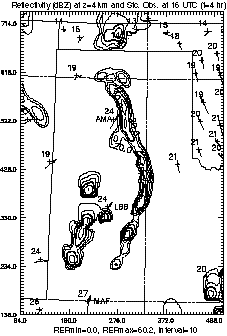
Despite the successful simulation of the location and mode of the convective band at 1800 UTC, its evolution before this time differs from what is observed. Fig. 2. shows the composite (vertical maximum) radar reflectivity calculated from water substances in the clouds for 1600 UTC. Two bands of convection are found that are oriented roughly in the N-S direction. The eastern band stretches through the Texas panhandle and the western Texas. Its northern end matches the observation at 1600 UTC (Fig.1) but its southern section did not exist in the observation. The western band is only seen in the western Texas area near the New Mexico border, similar to the southern section of the convective line observed two hours later. In other words, the initiation of northern section of the observed convection line is correctly simulated in both timing and location whereas the simulation of the southern section was not as successful, generating double convective bands instead of the single line.
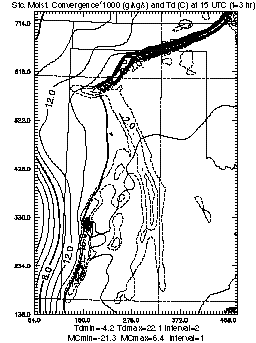
In the following, we try to understand the initiating processes of convection in the model. At 1200 UTC, the Texas panhandle and western Texas area are dominated by southwesterly or southerly flows at the surface. Two hours later, the dry-line moved into Texas and two narrow bands of moderate upward motion (about 0.1ms-1) and moisture convergence (over 1x10⁻³g(kg)-1s-1) developed in the originally sub-synoptic scale upward motion and moisture convergence zone. In this aspect, they are similar to the bands associated with dry lines studied by Ziegler et. al (1997). These two bands became more pronounced and narrow at 1500 UTC (Fig.3), roughly coincident with the two bands of convective clouds, developed later. Fig.4 shows the surface temperature and wind fields at 1500 UTC. Note that the band of very strong moisture convergence in Fig.3 in the Oklahoma panhandle and surrounding areas corresponds to the convection associated with the surface fronts. In the Texas panhandle and western Texas area, the eastern band of convergence is collocated with a very clear warm tongue on the surface and considerable temperature gradient is seen on both sides. The western band is located on the eastern edge of a region of considerable surface temperature gradient with a broad warm region to the east. Although the thermal gradient is only moderate, its coincidence with the moisture gradient in the same direction leads to a stronger gradient in virtual temperature.
 |
 |
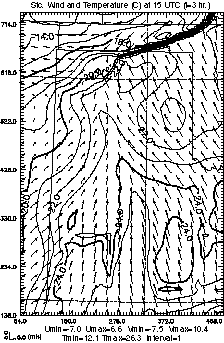 |
| Fig.2. Simulated composite radar reflectivity with surface temperature and wind plots for 1600 UTC. | Fig 3. Simulated moisture field (solid in g/kg) and moisture convergence (dash in 10-3g(kg)-1s-1) on the surface for 1500 UTC. | Fig.4 Simulated surface wind and temperature (C) field for 1500 UTC |
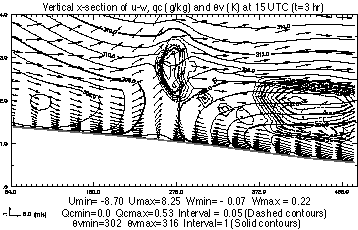
Fig.5 E-W cross section through Amarillo (AMA in Fig. 2) showing simulated [theta]v and u-w fields.
Fig.5 depicts the virtual potential temperature field on a vertical cross section intersecting the northern section of the eastern convergence band. The convergence band is located in a warm tongue not only on the surface but also in the entire planetary boundary layer and the most intense upward motion is to the east of the ridge where the horizontal gradient of [theta]v is stronger. Of course, the gradient of opposite direction to the west of the updraft also makes significant contribution to the upward motion. For the western Texas area, the eastern band is associated with a moderate [theta]v gradient to the east and the western band is associated with stronger gradient to the west, with a broad warm region of relatively uniform [theta]v between the convective bands.
Fig.5 also shows that the environment of the dryline, especially the vicinity of the band of boundary layer convergence, is characterized by a well-developed boundary layer with nearly constant [theta]v. In addition, the band is associated with a moist bulge and a diminishing cap. The sounding of Lubbock (LBB in Fig.2) taken at 1511 UTC (Fig.6) shows that this kind of structure is seen in the observation. The soundings extracted from the model output indicate that the cap has been weakening and shifting upwards at Lubbock. All of the model soundings from the simulated convergence bands have the above mentioned features and the convection occurs when the cap is removed by the upward motion.
Fig.6 Sounding observed at Lubbock (LBB in Fig.2) at 1511 UTC. The three lines depict (from left to right) dew point temperature, temperature and the path of the parcel from the surface, calculated using Tv.
From the above analysis, it is evident that the occurrence of the single band in the Texas panhandle area is associated with a warm tongue that developed in the middle of the panhandle with considerable thermal gradient on both sides whereas the two separated bands simulated in the western Texas area developed on the east and west side of a broad warm region, where thermal gradient is concentrated. Surface observations plotted in Fig.2 suggest that the simulated structure in the panhandle area is correct. For the western Texas area, the density of surface stations is not sufficient to make detailed comparison between the simulation and observation. However, there is still some evidence that the location of the convergence zone is not correctly simulated. Firstly, the wind observations at Lubbock and Midland (MAF in Fig.2) at 1500 UTC suggest that the convergence zone is oriented along the NNE-SSW line and located between the two simulated bands. Observed temperature at 1600 UTC (Fig.2) and 1700 UTC (not shown) also indicates that the surface warm tongue in the western Texas area may be near the line of LBB-MAF and it is more intense at 1700 UTC----around the time of observed convective initiation. If this scenario is correctly realized in the model, the initiation of convection between the two simulated bands at later time is well expected. Therefore the discrepancy between the simulation and observation is mainly due to the simulated low level thermal field in the western Texas area.
An inspection of the shallow soil temperature field (not shown) reveals a strong cold center in a shape of right angle, located to the south of Lubbock. This cold center in soil temperature blocked the northward extension of a warm tongue to the south and is responsible for the simulated structure in the surface air temperature and wind field. Tracking further back suggests that this is caused by the coarse resolution (about 1 degree latitude/longitude) of soil type.
4. DISCUSSIONS
The above analysis indicates that the timing and location of initiation of deep convection along a dryline can be correctly simulated with ARPS. The convection along the dry line on May 7, 1995 is initiated through the lift provided by the narrow convergence bands in the boundary layer that are associated with a warm tongue and/or significant thermal gradient. These thermally direct secondary convective boundary circulations are frontogenetic and solenoidally forced and probably generated by differential heating near the surface. Because the boundary layer heating is sensitive to the soil temperature and moisture and the time and location of the initiation of convection is sensitive to the meso-scale distribution of the heating, accurate representation of the soil type and vegetation type with a resolution comparable to that of model appear to be crucial for successfully simulating the convective initiation.
5. ACKNOWLEDGMENTS
This research was supported by the NSF grant ATM91-20009 to CAPS, and by a supplementary grant from FAA through NSF. The simulation was made on the Cray C90 at the Pittsburgh Supercomputing Center.
6. REFERENCES
Wang D., M. Xue, D. Hou and K. K. Drogenmeier: 1998: Midlatidude squall line propogation and structure as numerically simulated by a 3-D nonhydrostatic stormscale model. 16th Conf. Wea. Analysis and Forecasting. Amer. Metero. Soc., Phoenix, Arizona. This volume.
Xue, M., D. Wang, D. Hou and K. K. Drogenmeier: 1998: Prediction of the May 7, 1995 squall lines over the central US with intermittent data assimilation. 12th AMS Conf. on Num. Wea. Pre. Amer. Metero. Soc., Phoenix, Arizona.
Xue, M., K. K. Drogemeier, V. Wong, A. Shapiro, and K. Brewster, 1995: ARPS version 4.0 User's Guide. [Available from CAPS, Univ. of Oklahoma, 100 E. Boyed St., Norman, OK 73019], 380 pp.
Ziegler, C. L., T. J. Lee and R. A. Pielke Sr., 1997: Convective Initiation at dryline: A Modeling study. Mon. Wea. Rev., 125, 1001-1026.